
The Making of Trash Data Visualization
Online Trash Map
In August 2018 HOT together with Nipe Fagio organized waste data collection activity, allocating more than 100 students/mappers to locate and collect information about the types of piles in the Dar es salaam City.
The aim of this activity was to raise awareness to the responsible institutions for waste management about the importance of data-driven decision and policy making and also to showcase how waste data can be used to measure and evaluate the waste collection problem in Dar es salaam.
The activity resulted into collection of more than 10,000 waste piles. After the activity the HOT team presented the data to TURP program.
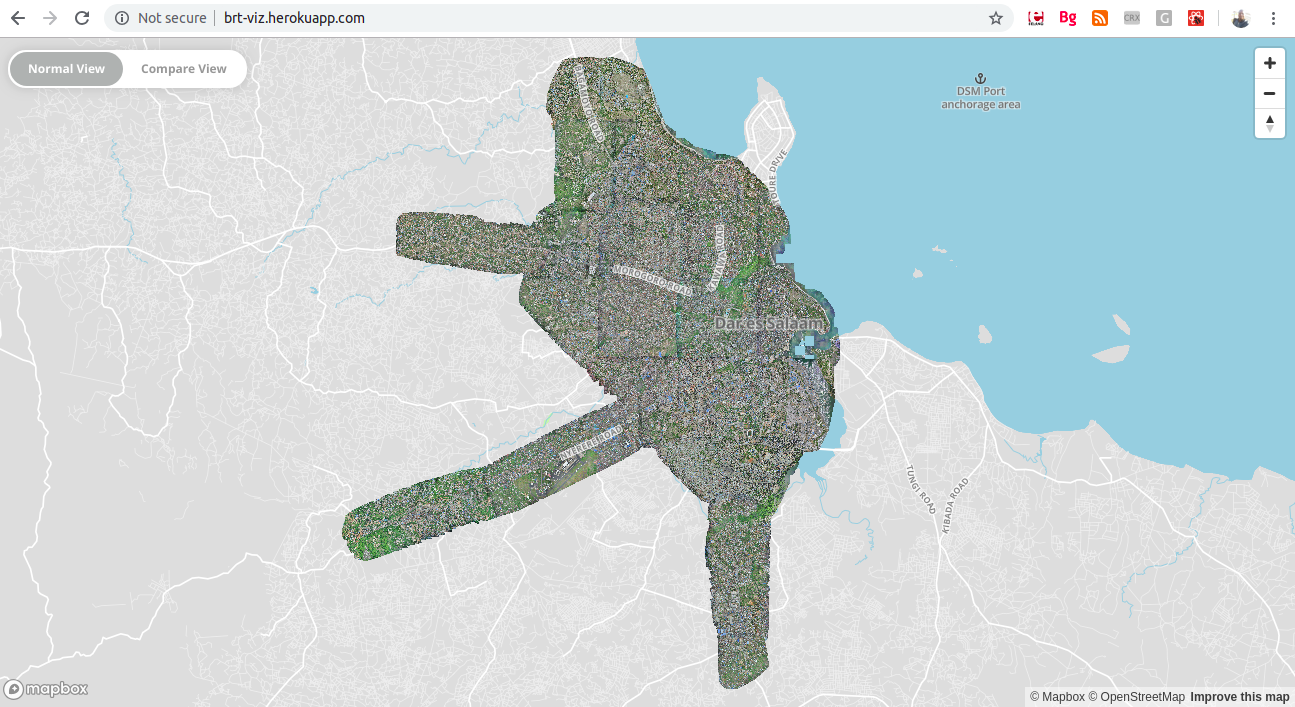
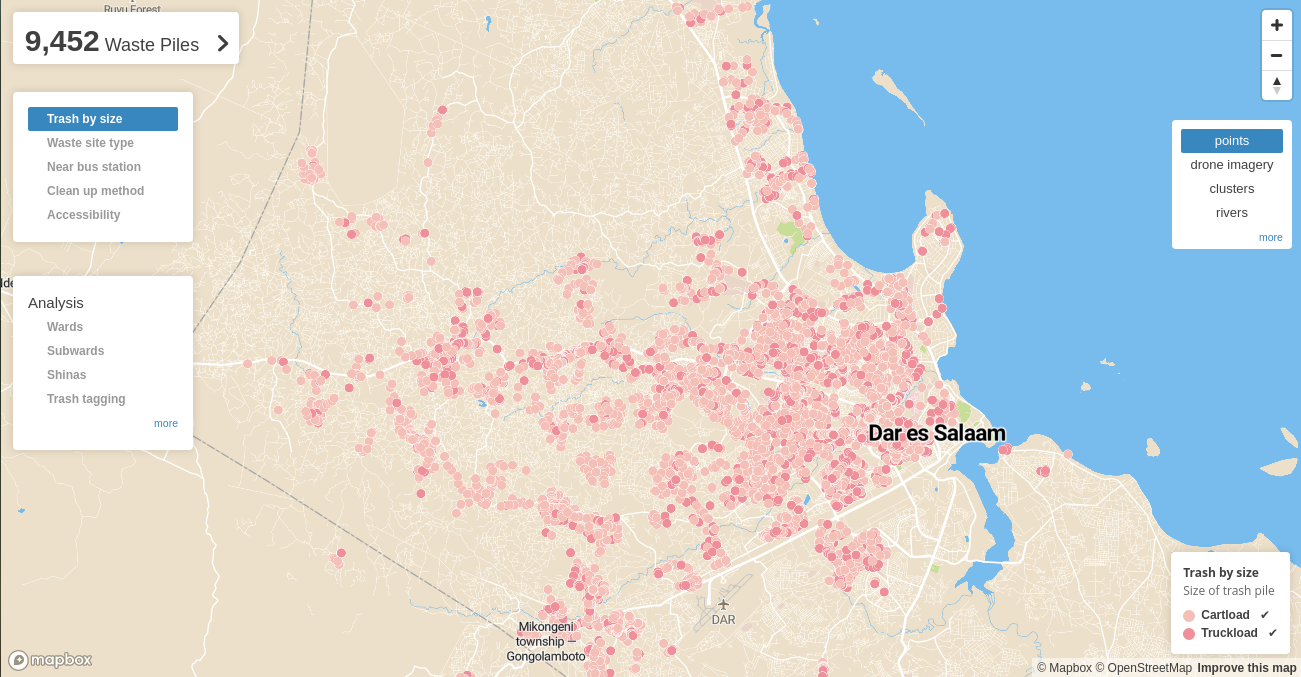
As part of TURP team, we analyzed the data and built a web map that visualized and provide important insights for the nearly 10,000 points. We used Mapbox GL JS together with a React framework, these enabled creating a vector based web map that has high rendering performance and a smooth user interaction.
The trash web map can be accessed here and source code for the map here.
Insights
The web map serves as an example of how spatial data and geospatial technologies can be leveraged to bridge the gap between available waste-related data and effective policymaking. The current waste management challenges in Dar es Salaam pose a significant obstacle to the city’s aspirations for urban development. Ensuring the availability and accessibility of reliable waste data is a crucial first step toward addressing this issue.
By enabling data analysis, such tools offer the ability to conduct informed and calculated assessments of main problems, thereby supporting evidence-based decision-making. One particular insight from the map is the high concentration of waste disposal sites in and around the city center—areas characterized by dense population, increased human activity, and vibrant local economies.
Such insights can reveal underlying behavioral patterns related to waste disposal. Once identified and analyzed, these patterns can inform solutions that are grounded in actual data, thereby increasing the likelihood of resolving the main challenges.
Moreover, the web-based map infographics indicate that many of these waste accumulation points are accessible by vehicles or carts, suggesting that targeted cleaning and maintenance activities are feasible. This accessibility further supports the potential for sustained cleanliness and improved waste management in these areas.
Future
Addressing waste collection challenges in Dar es Salaam through data-driven approaches, it is essential to incorporate a broader range of metrics and analyses. The city must recognize and integrate economic, environmental, and social indicators to develop comprehensive and sustainable waste management solutions. This multi-dimensional perspective is key to achieving a cleaner and more livable Dar es Salaam and other developing countries cities with similar challenges.
The trash map aims to inspire other partners and stakeholders to support and invest in data-centric waste management technologies. Tools like these play a critical role in highlighting the severity of the current waste problem and can drive informed actions toward meaningful change.